Using the TYPO3 Dashboard properly
EXT:dashboard has been in core for years, but sees little use because complete examples are missing. EXT:dashboard_base delivers demos for all widget types, new chart classes and ready-to-use widgets.
EXT:dashboard has been part of TYPO3 since version 10 and still rarely gets used properly. Not because the concept is flawed — a configurable widget dashboard covers real needs. The entry barrier is just high: documentation shows the interfaces but few complete examples. Anyone building custom widgets ends up digging through core code and existing extensions.
EXT:dashboard_base pursues three goals.
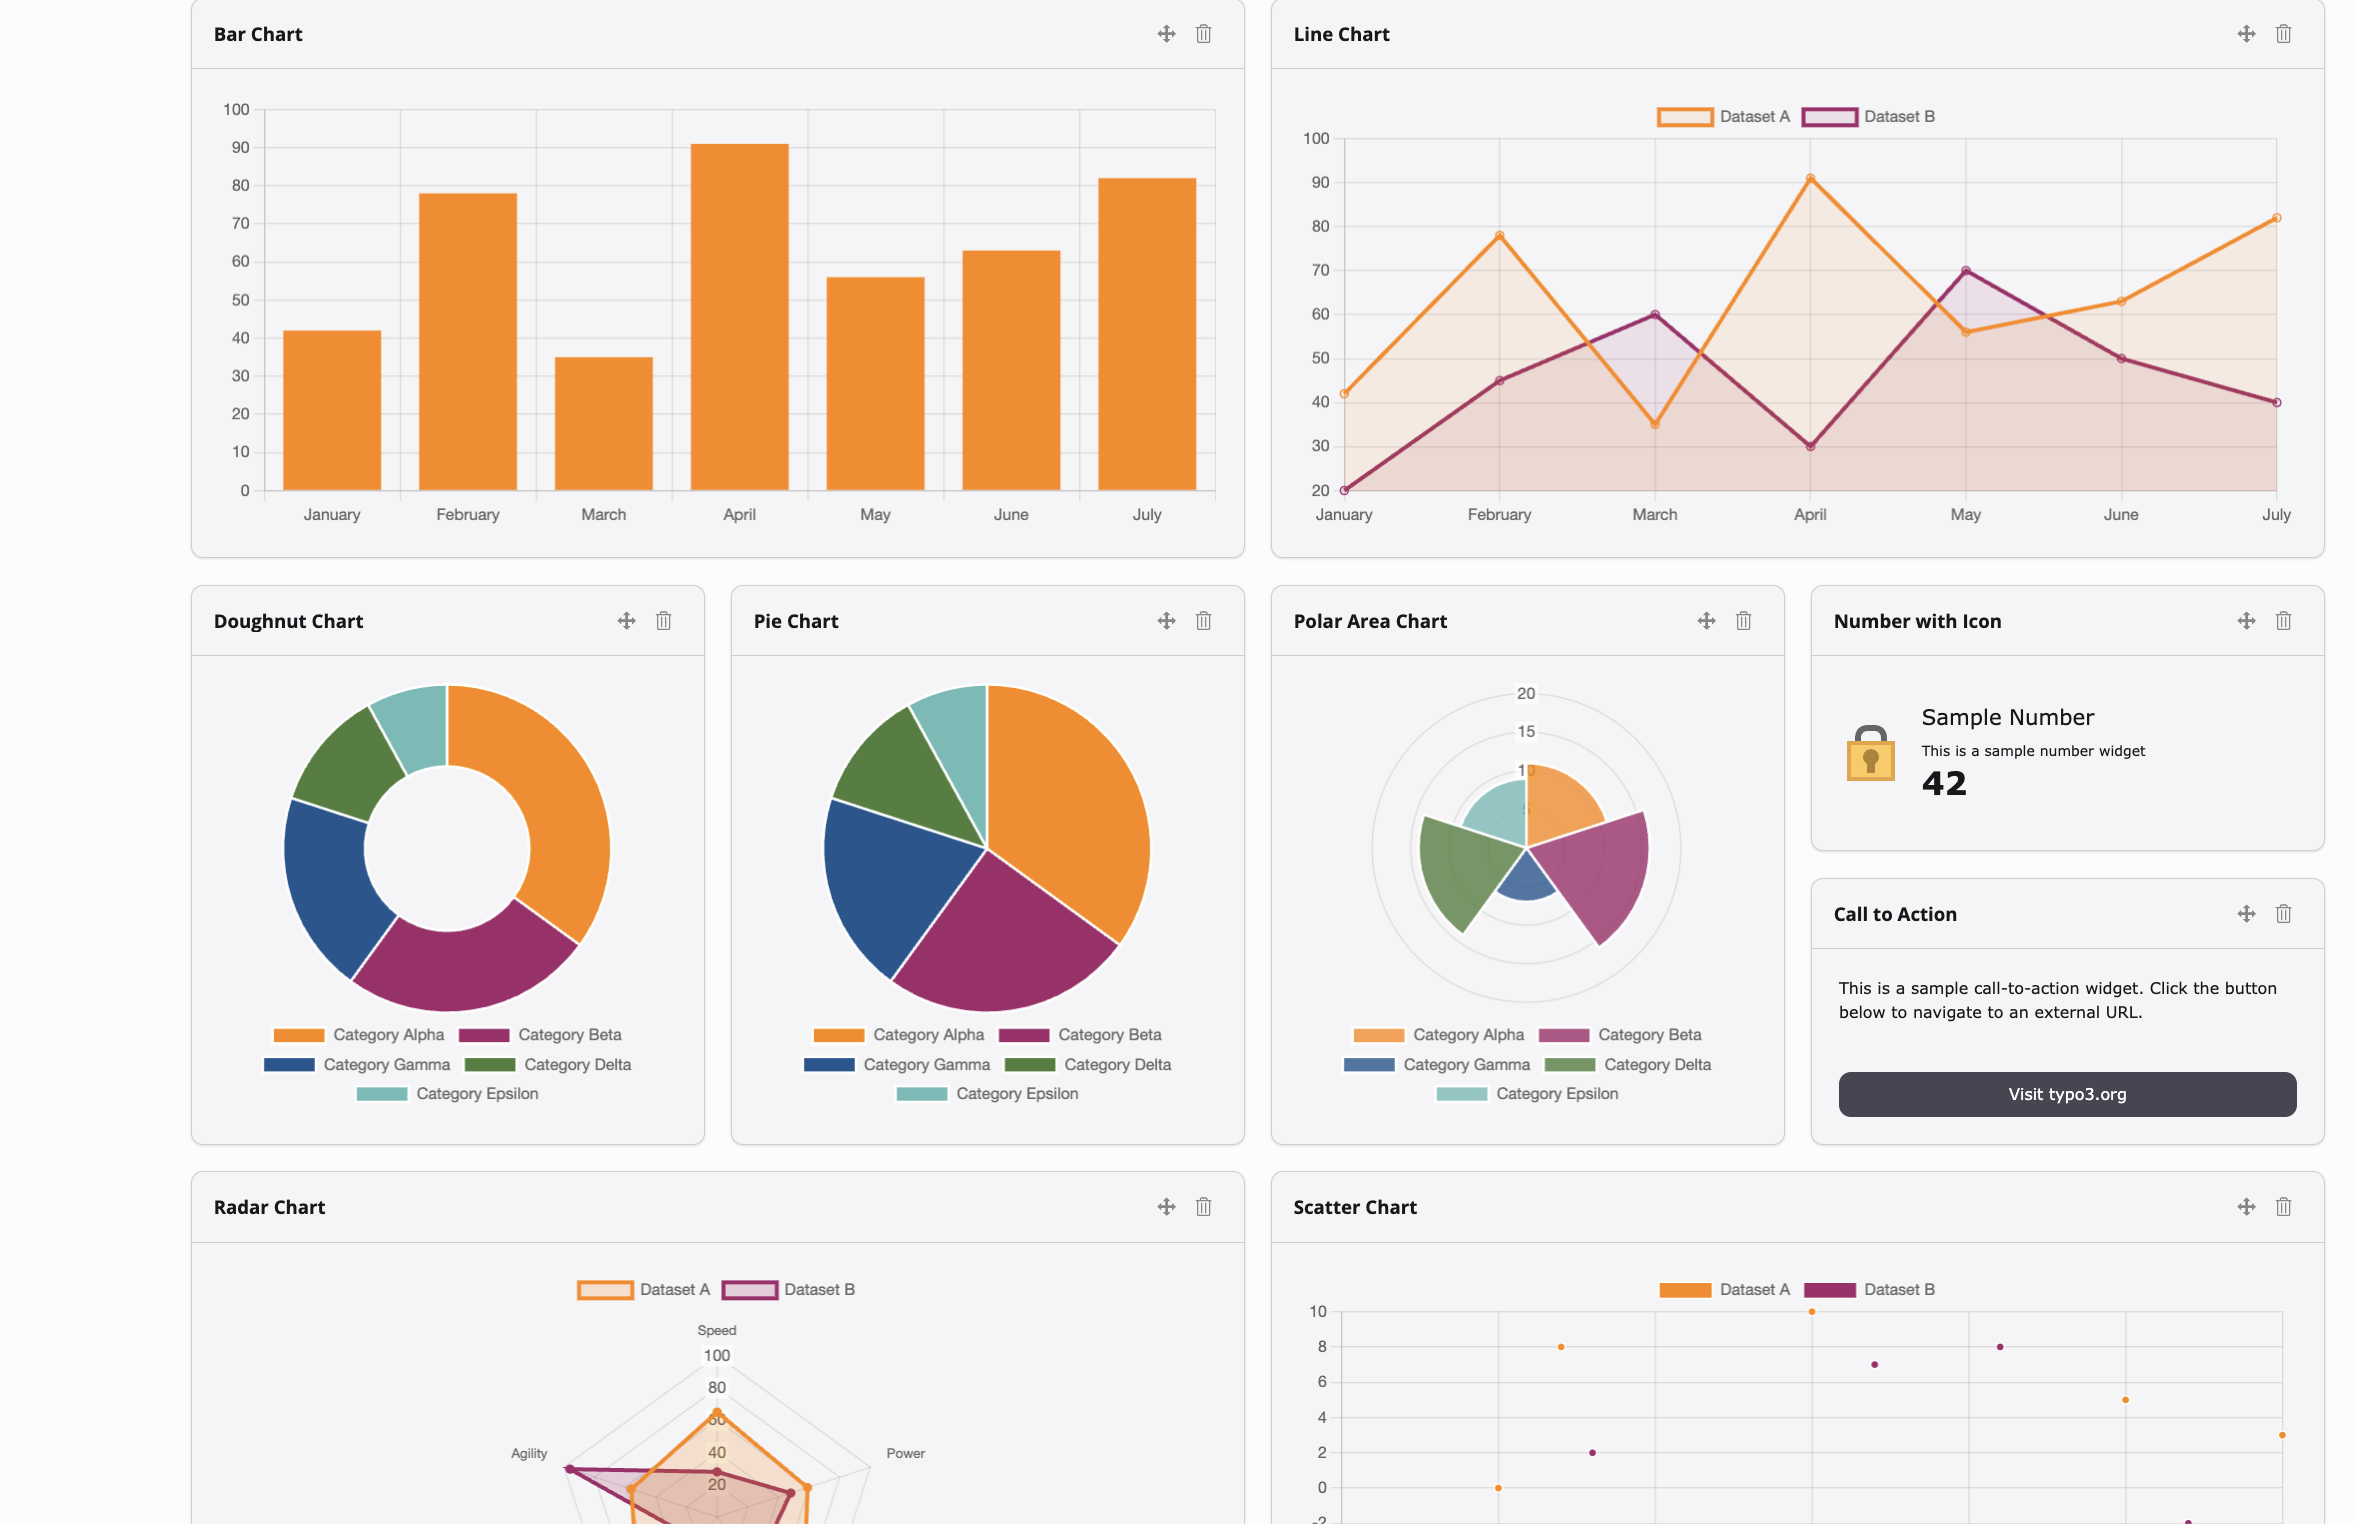
1. Demos for all widget types
TYPO3 ships two widget interfaces. The classic WidgetInterface is well known.
WidgetRendererInterface, the newer model with configurable widget settings, is
barely documented and almost absent from tutorials. On top come enhancement
interfaces for JavaScript, event data and similar, for which complete examples
are equally scarce.
The extension contains static demo widgets with dummy data for all these
variants, runnable and visible directly in your own TYPO3. SampleRendererWidget
demonstrates WidgetRendererInterface fully: configurable setting,
refreshable: true, custom label. Anyone building a new widget finds the right
starting pattern there.
2. New chart types
BarChartWidget and DoughnutChartWidget are the only chart widgets TYPO3
ships out of the box. Anyone needing a line chart or a radar diagram had to
implement everything from scratch before.
Dashboard_base adds seven more classes: LineChartWidget,
HorizontalBarChartWidget, PieChartWidget, PolarAreaChartWidget,
RadarChartWidget, ScatterChartWidget, BubbleChartWidget. All follow the
core pattern exactly: anyone who has built a BarChartWidget before just swaps
the class.
3. Production widgets with real operational data
The third part consists of widgets that can actually be used in production.
All use WidgetRendererInterface and are configurable via the widget panel.
Scheduler Tasks reads tx_scheduler_task and shows recent executions with
status and failure message. The task name comes from the description field or,
when empty, from the short class name of the task. Via the widget settings you
can switch to “failures only” and adjust the limit, without building a separate
widget class.
Storage Size shows the space used (MB) per file storage or file mount as a horizontal bar chart. On projects with many assets this is the quickest overview of where the space goes.
DB Table Sizes lists the largest database tables with row count and size. When a table grows unexpectedly you see it here without opening phpMyAdmin first.
Disk Space shows free and total space for the project directory. Site Statistics counts pages and content elements per site via recursive CTE directly from the page tree.